Globalized Math & Physical Science Standards:
Following are a handful of examples for providing global context for national math and physical science standards. Again, the goal is to spark ideas for things you can do in your classroom to provide students opportunity to investigate their worlds, recognize perspectives, communicate ideas, and take action.
I highly recommend the Graduation Performance System for Mathematics that is offered here by the Asia Society. http://asiasociety.org/algebra/mathematics-are-global-competencies and the Science version at http://asiasociety.org/competence/sciences-are-global-competencies
I highly recommend the Graduation Performance System for Mathematics that is offered here by the Asia Society. http://asiasociety.org/algebra/mathematics-are-global-competencies and the Science version at http://asiasociety.org/competence/sciences-are-global-competencies
Standard: F.LE.2 Construct linear and exponential functions, including arithmetic and geometric sequences, given a graph, a description of a relationship, or two input-output pairs (include reading these from a table.) (★) This standard is from the Functions Cluster of the Arizona College and Career Readiness Standards, or to the rest of the nation, Common Core Math Standards.
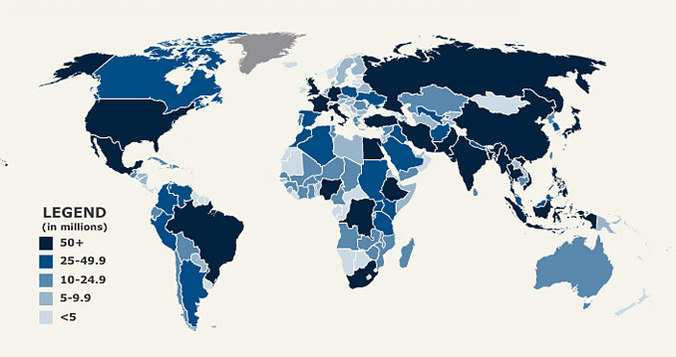
One idea to address this standard is to have students find population data throughout history (number of years may vary) from their zip code, city, state, nation, 7 nations throughout the world, and the world. Students should graph this data (population vs year) and then write mathematical models for various parts of the graph. While world population is definitely exponential over time, zooming in to specific areas and/or specific locations may show a different picture. Can students find examples of positive linear growth, negative linear growth, quadratic growth, exponential growth? Students should prove this both in Logger Pro and by creating tables of first order and second order changes and ratios of new to previous. Can students identify natural, political, social events that led to these particular trends? Can students provide reasoning for higher or lower rates of population growth in other countries versus the US? Students can use their mathematical models to interpolate and extrapolate the data in order to test their models and/or make predictions about populations in the future. They can identify limits of and issues related to population growth. Once students analyze the data and identify trends, they can engage in an ethical debate about population control. Students can find historic examples of population control. Ultimately, they can engage in a guided classroom debate around the questions: Should the UN advocate for population control? Is there an ethical way to control populations?
This lesson has a heavy focus on the Global Competency: Investigate Your World.
OXFAM: Knowledge and UnderstandingKnowledge
Sustainable development-global imperative of sustainable development-lifestyles for a sustainable world-understanding of key issues of Agenda 21-lifestyles for a sustainable world
OXFAM: SKILLS
-Critical thinking-critically analyzing information-making ethical judgments-handling contentious and complex issues
-Ability to argue effectively-arguing rationally and persuasively from an informed position-political literacy
OXFAM: VALUES AND ATTITUDES
Empathy and sense of common humanity-sense of common humanity and common needs-sense of individual and collective responsibility
Standard: G.MG.2 Apply concepts of density based on area and volume in modeling situations (e.g., persons per square mile, BTUs per cubic foot). (★) from Common Core Math Standards Modeling Geometry.
Standard: N.Q.1 Use units as a way to understand problems and to guide the solution of multi-step problems; choose and interpret units consistently in formulas; choose and interpret the scale and the origin in graphs and data displays. (★) from Common Core Math Number System Cluster (There is a heavy focus on Unit conversions)
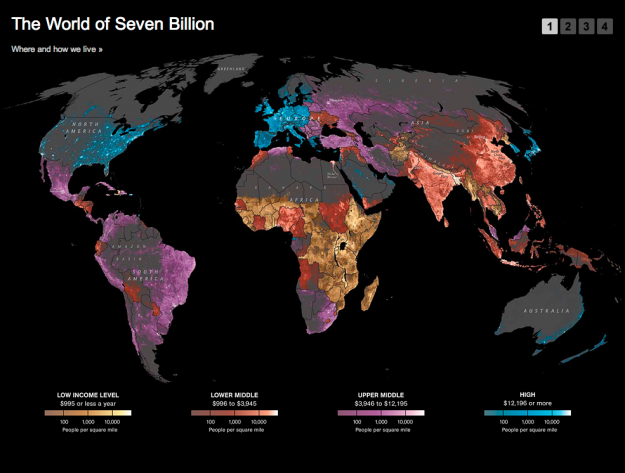
Teacher can use data from the article http://www.newgeography.com/content/002808-world-urban-areas-population-and-density-a-2012-update to ask students to calculate the population density (in ppl/square mile)of various cities around the world. Students can practice converting these ratios to ppl/square km. Students should be asked how much land is available per person. The statistic about the slums of Dhaka having a population density of 2.7million people per square mile would mean 10 square feet per person, assuming all land was residential and single story! Students propose that they must build vertically. Searches of images of Dhaka slums show large apartment buildings next to very shoddy single story shanties. Students have trouble picturing 2.7 million people, so images of people riding Dhaka trains help them envision large amounts of people and give rise to questions about food access, jobs, living conditions, water resources, and more. Students should calculate the population density of large US cities (even LA is low!, be careful with NYC statistic as it includes CT NJ, which can skew data) Applications of this can vary, we recently discussed definitions of urban, suburban, and rural in terms of population density and built environment and students described Phoenix as an urban built environment with suburban/rural population densities. This led to discussion on suburban sprawl and sustainability. Other applications could include a discussion of living conditions, the fact that the US accounts for 5% of the world population but uses 30% of the resources, and more!
This lesson while still heavy on Investigating the World through data, really helped bring perspective to my students. They always hear about population growth and sustainability; however, without feeling the effects of limited resources (even our poorest students were in shock!) and/or high population density, they really don’t see the world from this perspective.
OXFAM: SKILLS
-Critical thinking-critically analyzing information-making ethical judgments-handling contentious and complex issues
-Concern for the environment and commitment to sustainable development-concern for the future of the planet and future generations-commitment to a lifestyle for a sustainable world-commitment to sustainable development
Standard: N.Q.1 Use units as a way to understand problems and to guide the solution of multi-step problems; choose and interpret units consistently in formulas; choose and interpret the scale and the origin in graphs and data displays. (★) from Common Core Math Number System Cluster (There is a heavy focus on Unit conversions)
Teacher can use data from the article http://www.newgeography.com/content/002808-world-urban-areas-population-and-density-a-2012-update to ask students to calculate the population density (in ppl/square mile)of various cities around the world. Students can practice converting these ratios to ppl/square km. Students should be asked how much land is available per person. The statistic about the slums of Dhaka having a population density of 2.7million people per square mile would mean 10 square feet per person, assuming all land was residential and single story! Students propose that they must build vertically. Searches of images of Dhaka slums show large apartment buildings next to very shoddy single story shanties. Students have trouble picturing 2.7 million people, so images of people riding Dhaka trains help them envision large amounts of people and give rise to questions about food access, jobs, living conditions, water resources, and more. Students should calculate the population density of large US cities (even LA is low!, be careful with NYC statistic as it includes CT NJ, which can skew data) Applications of this can vary, we recently discussed definitions of urban, suburban, and rural in terms of population density and built environment and students described Phoenix as an urban built environment with suburban/rural population densities. This led to discussion on suburban sprawl and sustainability. Other applications could include a discussion of living conditions, the fact that the US accounts for 5% of the world population but uses 30% of the resources, and more!
This lesson while still heavy on Investigating the World through data, really helped bring perspective to my students. They always hear about population growth and sustainability; however, without feeling the effects of limited resources (even our poorest students were in shock!) and/or high population density, they really don’t see the world from this perspective.
OXFAM: SKILLS
-Critical thinking-critically analyzing information-making ethical judgments-handling contentious and complex issues
-Concern for the environment and commitment to sustainable development-concern for the future of the planet and future generations-commitment to a lifestyle for a sustainable world-commitment to sustainable development
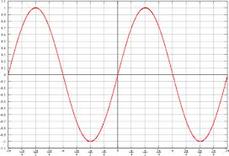
Model periodic phenomena with trigonometric functions
F-TF.5. Choose trigonometric functions to model periodic phenomena with specified amplitude, frequency, and midline.★ From Common Core Math Functions Cluster.
After studying various physical phenomena, spring oscillations, wave functions, pendula motion, circular motion, etc., challenge students to find examples of historical cyclical behavior that can be modeled with as trigonometric functions. Last year, my Junior students were doing a large unit on Revolutions in their Humanities course while we were learning trig in Precalculus and (accidentally!) language from Math began to be a common use in Humanities and patterns they found among various Revolutions were discussed in Precalculus. I’m not exactly sure what students will end up graphing and it may be more qualitative than quantitative, that’s part of the exciting part of this challenge; however, I believe trying to quantify historical patterns gives students greater conceptual understanding of trig functions and allows them to ask and search for answers to questions such as, “What is equilibrium?” “What factors are causing the system to move in and out of equilibrium?” “What is the restoring force on the system?” “Is the oscillation dampening? Why (not)?” This allows them to make comparisons between physical and social systems.
This, as any global math unit probably, is heavy in investigating our world. The underlying question is how can we model history and interactions? Again, global standards that could be added include:
OXFAM: SKILLS
-Critical thinking-critically analyzing information-making ethical judgments-handling contentious and complex issues
The second is a guess that their examples will uncover:
-Globalisation and interdependence-power relationships North/South-world economic and political systems-ethical consumerism-complexity of global issues
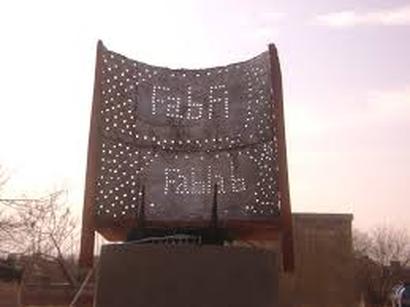
HS-PS4-5 Communicate technical information about how some technological devices use the principles of wave behavior and wave interactions with matter to transmit and capture information and energy.* Next Generation Science Standards
Explore FabFi, a WIFI service made of $60 (and less) parts that has been implemented in Afghanistan and Kenya. The nodes are made out of USAID oil cans (perfectly shaped!) to reflect radio waves to converge at a focal point. As I understand it, a router antenna is placed at the focal point, and amplifies the signal across many miles. There is a cloud of WIFI service around each node, and the overlap of clouds provides a complex network that allows service even in bad weather, system damage, and signal interference. I would love for students to make a small node to demonstrate this principle and then explain how the signal waves interact with matter to capture and transfer information and energy. Also, students should dig into the history of FabFi and assess the pros and cons of this information access (this exploration can also include FabLabs!) There is a ton of opportunity for tying in advanced geometry standards, networking (Discrete mathematics) and parabolic focal points, as well as learning how this technology works and the role of wave nature in carrying the information. Ideally, the students would make nodes and do an investigation on how far the signal is broadcasted, but I need to do more research into how this technology works before I get too carried away! The main mission of FabFi is to provide information resources to underserved areas. This access to knowledge is key to democratization and empowerment of the people.
This unit, if developed completely, could be strongest in the global competency of taking action. The strength of the unit is that local people along with university representatives created a network that provides people access to education, medical, and political information, for a sliver of the cost of the US military! A little ingenuity and a lot of repurposing materials can make a HUGE impact on an entire region. I’m convinced that with the right resources, students could repurpose this idea and bring cheap/free Internet access to rural and under served schools and communities.
Ability to challenge injustice and inequalities-selecting appropriate action to take against inequality-campaigning for a more just and equitable world
Belief that people can make a difference-willingness to work towards a more equitable future
Commitment to social justice and equity-commitment to social justice and equity-commitment to the eradication of poverty

HS-PS2-1 Analyze data to support the claim that Newton’s second law of motion describes the mathematical relationship among the net force on a macroscopic object, its mass, and its acceleration.
HS-PS2-2 Use mathematical representations to support the claim that the total momentum of a system of objects is conserved when there is no net force on the system.
HS-PS2-3 Apply scientific and engineering ideas to design, evaluate, and refine a device that minimizes the force on a macroscopic object during a collision.
From Next Generation Science Standards Forces and Motion Cluster
Forces and Motion can be tied to a larger Unit on Transportation Safety, especially looking at collisions between cars and pedestrians and cars and bicycles. This unit is engaging to teens as they are entering driving age and calculation of the forces and accelerations bodies undergo really helps them understand the dangers of distracted driving and speeding. Students can create safe driving campaigns and design cars, helmets, street designs that minimize the force on an object. To globalize this lesson, and provide a focus on sustainability, a focus on increasing bicycle safety and thus increasing the number of bikes on the road can be added. This article gives a nice look at policies and strategies that the Netherlands, Denmark, and Germany have implemented successfully and the USA and England have ignored.
http://www.cycling-embassy.org.uk/sites/cycling-embassy.org.uk/files/documents/irresistible.pdf
Also, traffic and transportation safety for Arizona is readily available online, and my plan is to search for the same data for cities throughout the world. One very interesting phenomena is that of the psychology of safety, the risk threshold. There is overwhelming evidence that if a road, intersection, etc. looks too safe, drivers will drive faster and take more risks. After giving examples of this and investigating street planning ideas for making an intersection safer (in Phoenix we widen the road and reduce corners to increase visibility), students will research driving, walking, or biking in a city in another country. There is a great blog post about driving in Morocco at http://www.legalnomads.com/2011/11/driving-in-morocco.html as a start. Also, they can use Epals to talk to students around the world about their experiences with driving, getting licenses, transportation safety, and more.
Implementation Examples:
Google Earth testimonial:
In our integrated Freshmen sessions, we always end the week with an elaboration activity, a chance for students to apply their learning to a new, but related, situation. Our guiding theme of the week was urban vibrancy, and students had studied walkability, environmental justice, population densities, the connection between environment and health, and more. We started the week with a walking tour of Downtown Phoenix, looking for specific examples of walkability (from Jeff Speck’s book Walkable City). On Friday, I wrote an elaborate piece for all Freshmen that allowed them to evaluate the Urban Vibrancy of various cities around the world, using Google Earth. Groups of four were assigned one of nine cities (NYC, Portland, Tokyo, Santiago, Paris, Bangkok, Jerusalem, Mexico City, Toronto) and given 20 minutes to drop into street level view of various neighborhoods throughout the city. The recorded their observations in their notebooks. They then shared their observations with other members of their groups. Teams then worked together to make a two minute presentation about the Urban Vibrancy of the city using Claim, Evidence, Reasoning format. |

Edmodo testimonial: This week I implemented technology in two different activities, one globally based and one geared towards student to student communication and collaboration, with potential for global connections. I usually use Edmodo for announcements, posting links to resources, and as a central point for submitting digital assignments. When I asked current Seniors what works best for them with technology, they said they enjoyed the Edmodo discussion format used by Senior teachers. I haven’t had time to talk with these teachers about their methods, but I interpreted in my own way! This week my students were writing surveys (focused on overarching research questions, target populations, questioning and answering bias, and sampling) to be conducted at Food Truck Friday, a local downtown event. Groups of nine worked to develop a storyline and questions and worked collaboratively in Google Docs. In class on Thursday, groups posted their surveys on Edmodo. Then, members of each group had to comment on another team’s survey. The goal of the comments were two-fold: 1) to give advice to groups and offer specific changes and 2) to show understanding of questions, populations, and bias. I provided a model response on another survey we had analyzed earlier in the week. The responses were very thoughtful and showed who understood these concepts and who had gaps and the feedback was used to greatly improve the surveys. |

I really enjoyed both of these new approaches to technology and will do both again. The Edmodo piece provides a nice format for peer to peer discussion. One change I made between first and second hours, was to not allow students to respond to the feedback during the hour. The point of the assignment was not a debate, or defense of their survey, but a chance to receive constructive criticism and then make decisions about revision after discussing the feedback with their group. Based on comments above from Seniors, I will be sure not to overuse this format. As for the Google Earth activity, I love that it gave students, many of whom have never even left Phoenix, a chance to “travel” the world. The students were engaged and naturally made comparisons between the Phoenix and the cities they were investigating. I did not know Google Earth was installed on all computers before this week and now that I do, I will make sure to use it when we are discussing specific places. The only weakness of the activity is that you are limited to using cities that have street-view available. As Google maps the world, the extensions of this activity will grow.
|
